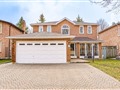
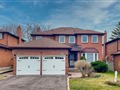
43 Byer Dr
$1,554,335
Comparative Market Analysis
Apr 17, 2024
NOT AN ACTIVE LISTING
Historical Performance
| Period | $ Change | % Change |
| 1 Day | +$376 | +0.024% |
| 7 Days | -$20 | -0.001% |
| 30 Days | -$3,617 | -0.232% |
| 3 Months | -$6,343 | -0.406% |
| 6 Months | +$22.8k | +1.49% |
| 1 Year | -$80.0k | -4.90% |
| 3 Years | +$250k | +19.2% |
| 5 Years | +$376k | +31.9% |
| 10 Years | +$844k | +119% |
List My Property
Real Estate Statistics
Financing Solutions
AS SEEN ON


Are You a Licensed Real Estate Agent or Broker?