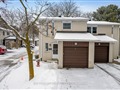
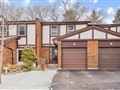
320 John St 103
$727,654
Comparative Market Analysis
May 20, 2025
NOT AN ACTIVE LISTING
Historical Performance
| Period | $ Change | % Change |
| 1 Day | +$268 | +0.037% |
| 7 Days | +$676 | +0.093% |
| 30 Days | +$289 | +0.040% |
| 3 Months | +$747 | +0.103% |
| 6 Months | +$13.7k | +1.91% |
| 1 Year | -$26.9k | -3.56% |
| 3 Years | +$129k | +21.5% |
| 5 Years | +$229k | +46.0% |
| 10 Years | +$425k | +140% |
List My Property
Real Estate Statistics
Financing Solutions
AS SEEN ON


Are You a Licensed Real Estate Agent or Broker?