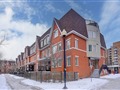
320 John St 112
$704,043
Comparative Market Analysis
Apr 29, 2025
NOT AN ACTIVE LISTING
Historical Performance
| Period | $ Change | % Change |
| 1 Day | +$259 | +0.037% |
| 7 Days | +$593 | +0.084% |
| 30 Days | -$23 | -0.003% |
| 3 Months | -$274 | -0.039% |
| 6 Months | +$11.1k | +1.60% |
| 1 Year | -$31.1k | -4.23% |
| 3 Years | +$107k | +17.8% |
| 5 Years | +$192k | +37.4% |
| 10 Years | +$387k | +122% |
List My Property
Real Estate Statistics
Financing Solutions
Browsing History
308 John St 206, Markham
1 second ago
318 John St 125, Markham
2 seconds ago
312 John St 361, Markham
3 seconds ago
306 John St 267, Markham
4 seconds ago
310 John St 313, Markham
5 seconds ago
AS SEEN ON


Are You a Licensed Real Estate Agent or Broker?