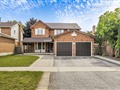
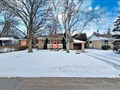
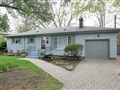
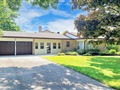
33 Fincham Ave
$1,456,422
Comparative Market Analysis
Jul 1, 2025
NOT AN ACTIVE LISTING
Historical Performance
| Period | $ Change | % Change |
| 1 Day | +$340 | +0.023% |
| 7 Days | -$91 | -0.006% |
| 30 Days | -$3,622 | -0.248% |
| 3 Months | -$6,485 | -0.443% |
| 6 Months | +$20.7k | +1.44% |
| 1 Year | -$75.6k | -4.93% |
| 3 Years | +$244k | +20.1% |
| 5 Years | +$368k | +33.8% |
| 10 Years | +$827k | +131% |
List My Property
Real Estate Statistics
Financing Solutions
Browsing History
63 Larkin Ave, Markham
6 seconds ago
44 Graham Cres, Markham
11 seconds ago
141 Larkin Ave, Markham
16 seconds ago
75 Larkin Ave, Markham
21 seconds ago
84 Fincham Ave, Markham
26 seconds ago
29 Balsam St, Markham
31 seconds ago
106 Larkin Ave, Markham
35 seconds ago
AS SEEN ON

Are You a Licensed Real Estate Agent or Broker?