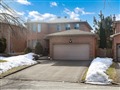
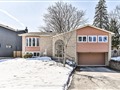
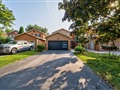
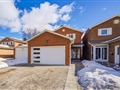
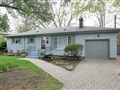
33 Sir Lancelot Dr
$2,543,565
Comparative Market Analysis
Jul 7, 2025
NOT AN ACTIVE LISTING
Historical Performance
| Period | $ Change | % Change |
| 1 Day | +$593 | +0.023% |
| 7 Days | -$160 | -0.006% |
| 30 Days | -$6,326 | -0.248% |
| 3 Months | -$11.3k | -0.443% |
| 6 Months | +$35.7k | +1.42% |
| 1 Year | -$135k | -5.04% |
| 3 Years | +$413k | +19.4% |
| 5 Years | +$619k | +32.1% |
| 10 Years | +$1.41m | +124% |
List My Property
Real Estate Statistics
Financing Solutions
AS SEEN ON


Are You a Licensed Real Estate Agent or Broker?