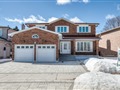
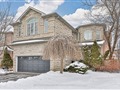
41 Beck Dr
$1,610,023
Comparative Market Analysis
Jul 1, 2025
NOT AN ACTIVE LISTING
Historical Performance
| Period | $ Change | % Change |
| 1 Day | +$389 | +0.024% |
| 7 Days | -$55 | -0.003% |
| 30 Days | -$3,913 | -0.242% |
| 3 Months | -$7,106 | -0.439% |
| 6 Months | +$22.5k | +1.42% |
| 1 Year | -$85.3k | -5.03% |
| 3 Years | +$252k | +18.6% |
| 5 Years | +$387k | +31.6% |
| 10 Years | +$904k | +128% |
List My Property
Real Estate Statistics
Financing Solutions
Browsing History
5 White Ash Dr, Markham
6 seconds ago
19 Beck Dr, Markham
11 seconds ago
24 Beck Dr, Markham
16 seconds ago
351 Manhattan Dr, Markham
18 seconds ago
AS SEEN ON

Are You a Licensed Real Estate Agent or Broker?