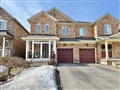
48 John Gary Dr
$1,156,829
Comparative Market Analysis
Jul 11, 2025
NOT AN ACTIVE LISTING
Historical Performance
| Period | $ Change | % Change |
| 1 Day | +$644 | +0.056% |
| 7 Days | +$1,684 | +0.146% |
| 30 Days | -$1,660 | -0.143% |
| 3 Months | -$5,750 | -0.495% |
| 6 Months | +$15.3k | +1.34% |
| 1 Year | -$56.7k | -4.67% |
| 3 Years | +$212k | +22.5% |
| 5 Years | +$318k | +37.9% |
| 10 Years | +$656k | +131% |
List My Property
Real Estate Statistics
Financing Solutions
Browsing History
Doubtfire Cres, Markham
2 seconds ago
57 Via Jessica Dr, Markham
3 seconds ago
Fordcombe Cres, Markham
4 seconds ago
Laird Dr, Markham
5 seconds ago
15 Cornell Meadows Ave, Markham
6 seconds ago
20 Cornell Meadows Ave, Markham
7 seconds ago
3309 Denison St, Markham
8 seconds ago
51 John Gary Dr, Markham
9 seconds ago
Alberbury Dr, Markham
10 seconds ago
76 Jack Monkman Cres, Markham
11 seconds ago
AS SEEN ON

Are You a Licensed Real Estate Agent or Broker?