SALES HISTORY
MARKET STATS
PROPERTY DESCRIPTION
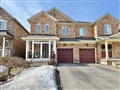
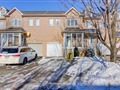
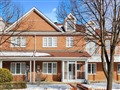
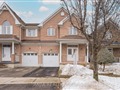
50 John Gary Dr is a 3-bedroom 4-washroom freehold townhouse located in Village Green-South Unionville community of Markham. It is currently NOT FOR SALE, but is
worth in our opinion around $1,172,921
.
The property is situated on a 20' frontage by 129' deep lot. 50 John Gary Dr is currently not for sale and is not an active listing on Listing.ca.
NEARBY SCHOOLS
Highgate Public School
4.4 km
35 Highgate Dr, L3R3R5
Phone: (905) 477-1019
Ivy League Montessori Inc
4.2 km
9899 Markham Rd, L3P3J3
Phone: (905) 472-5500
Marander Montessori School
4.2 km
5906 16th Ave, L3P3J3
Phone: (905) 471-7118
MindTech Montessori Schools
4.2 km
1 Dickson Hill Rd, L3P3J3
Phone: (905) 640-5333
North Markham Nursery School
4.2 km
5438 Major MacKenzie Dr E, L3P3J3
Phone: (905) 294-0707
Radiant Way Montessori
4.2 km
9718 McCowan Rd, L3P3J3
Phone: (905) 472-8113
Unionville Meadows Public School
0.2 km
355 South Unionville Ave, L3R5C8
Phone: (905) 479-4795
Young Drivers Of Canada
4.2 km
5362 Highway 7, L3P3J3
Phone: (905) 944-0478
Yrdsb Highgate Ps
4.4 km
35 Highgate Dr, L3R3R5
Phone: (905) 477-9399
NEARBY GROCERY STORES
Sobeys
4.2 km
9580 McCowan Rd, L3P3J3
Phone: (905) 887-4366
NEARBY PHARMACIES
Custom Care Pharmacy
1.1 km
32 S Unionville Ave, L3R6B8
Phone: (905) 305-0111
Shoppers Drug Mart
4.2 km
9620 McCowan Rd, L3P3J3
Phone: (905) 927-2618
NEARBY RESTAURANTS AND CAFETERIAS
Tikka Tikka Indian Delight
4.2 km
6001 14th Ave, L3P3J3
Phone: (416) 297-1438
NEARBY HEALTH AND FITNESS FACILITIES
Taoist Taichi Society Of Canada
4.2 km
124 Dickson Hill Rd, L3P3J3
Phone: (905) 640-0117