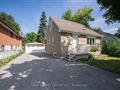
55 John St
$2,741,275
Comparative Market Analysis
Jun 29, 2025
NOT AN ACTIVE LISTING
Historical Performance
| Period | $ Change | % Change |
| 1 Day | +$600 | +0.022% |
| 7 Days | +$133 | +0.005% |
| 30 Days | -$4,953 | -0.180% |
| 3 Months | -$5,608 | -0.204% |
| 6 Months | +$52.4k | +1.95% |
| 1 Year | -$116k | -4.05% |
| 3 Years | +$430k | +18.6% |
| 5 Years | +$627k | +29.7% |
| 10 Years | +$1.60m | +139% |
List My Property
Real Estate Statistics
Financing Solutions
AS SEEN ON


Are You a Licensed Real Estate Agent or Broker?