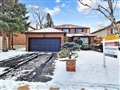
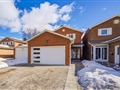
65 Fincham Ave
$1,563,922
Comparative Market Analysis
Jul 1, 2025
NOT AN ACTIVE LISTING
Historical Performance
| Period | $ Change | % Change |
| 1 Day | +$365 | +0.023% |
| 7 Days | +$18 | +0.001% |
| 30 Days | -$3,318 | -0.212% |
| 3 Months | -$5,097 | -0.325% |
| 6 Months | +$25.8k | +1.68% |
| 1 Year | -$73.8k | -4.50% |
| 3 Years | +$285k | +22.3% |
| 5 Years | +$436k | +38.7% |
| 10 Years | +$924k | +144% |
List My Property
Real Estate Statistics
Financing Solutions
Browsing History
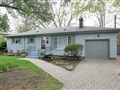
98 Fincham Ave, Markham
1 second ago
AS SEEN ON


Are You a Licensed Real Estate Agent or Broker?