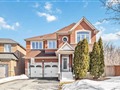
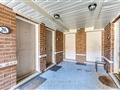
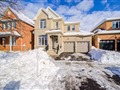
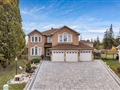
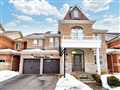
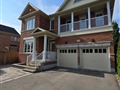
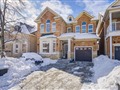
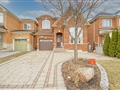
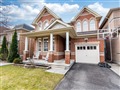
66 Sanders Dr
$1,981,672
Comparative Market Analysis
Jul 6, 2025
NOT AN ACTIVE LISTING
Historical Performance
| Period | $ Change | % Change |
| 1 Day | +$457 | +0.023% |
| 7 Days | +$112 | +0.006% |
| 30 Days | -$3,677 | -0.185% |
| 3 Months | -$4,329 | -0.218% |
| 6 Months | +$38.2k | +1.97% |
| 1 Year | -$77.3k | -3.75% |
| 3 Years | +$398k | +25.1% |
| 5 Years | +$612k | +44.6% |
| 10 Years | +$1.20m | +153% |
List My Property
Real Estate Statistics
Financing Solutions
AS SEEN ON


Are You a Licensed Real Estate Agent or Broker?