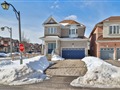
67 Harry Cook Dr
$1,476,778
Comparative Market Analysis
Jul 4, 2025
NOT AN ACTIVE LISTING
Historical Performance
| Period | $ Change | % Change |
| 1 Day | +$304 | +0.021% |
| 7 Days | -$171 | -0.012% |
| 30 Days | -$3,663 | -0.247% |
| 3 Months | -$5,861 | -0.395% |
| 6 Months | +$22.8k | +1.57% |
| 1 Year | -$74.3k | -4.79% |
| 3 Years | +$201k | +15.7% |
| 5 Years | +$492k | +50.0% |
| 10 Years | +$914k | +162% |
List My Property
Real Estate Statistics
Financing Solutions
Browsing History
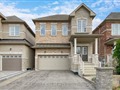
45 Kingfisher Cove Way, Markham
4 seconds ago
AS SEEN ON

Are You a Licensed Real Estate Agent or Broker?