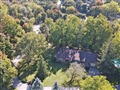
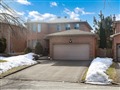
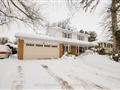
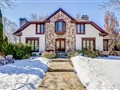
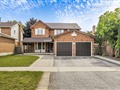
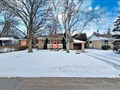
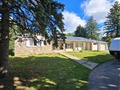
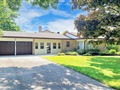
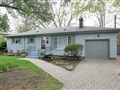
93 Fincham Ave
$2,104,310
Comparative Market Analysis
Jul 1, 2025
NOT AN ACTIVE LISTING
Historical Performance
| Period | $ Change | % Change |
| 1 Day | +$491 | +0.023% |
| 7 Days | +$73 | +0.003% |
| 30 Days | -$4,235 | -0.201% |
| 3 Months | -$6,186 | -0.293% |
| 6 Months | +$35.9k | +1.74% |
| 1 Year | -$97.4k | -4.43% |
| 3 Years | +$381k | +22.1% |
| 5 Years | +$580k | +38.1% |
| 10 Years | +$1.27m | +152% |
List My Property
Real Estate Statistics
Financing Solutions
Browsing History
52 Fincham Ave, Markham
5 seconds ago
193 Fincham Ave, Markham
10 seconds ago
21 Crandall Dr, Markham
12 seconds ago
AS SEEN ON

Are You a Licensed Real Estate Agent or Broker?