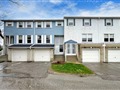
1964 John St 148
$782,813
Comparative Market Analysis
Apr 28, 2024
NOT AN ACTIVE LISTING
Historical Performance
| Period | $ Change | % Change |
| 1 Day | +$289 | +0.037% |
| 7 Days | +$627 | +0.080% |
| 30 Days | -$179 | -0.023% |
| 3 Months | -$787 | -0.100% |
| 6 Months | +$11.3k | +1.46% |
| 1 Year | -$37.6k | -4.59% |
| 3 Years | +$105k | +15.5% |
| 5 Years | +$197k | +33.5% |
| 10 Years | +$407k | +108% |
List My Property
Real Estate Statistics
Financing Solutions
AS SEEN ON


Are You a Licensed Real Estate Agent or Broker?