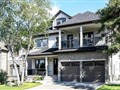
41 Blackwell Crt
$2,361,881
Comparative Market Analysis
Apr 27, 2024
NOT AN ACTIVE LISTING
Historical Performance
| Period | $ Change | % Change |
| 1 Day | +$508 | +0.022% |
| 7 Days | -$290 | -0.012% |
| 30 Days | -$6,153 | -0.260% |
| 3 Months | -$10.7k | -0.451% |
| 6 Months | +$33.4k | +1.43% |
| 1 Year | -$126k | -5.06% |
| 3 Years | +$399k | +20.3% |
| 5 Years | +$522k | +28.4% |
| 10 Years | +$1.24m | +111% |
List My Property
Real Estate Statistics
Financing Solutions
AS SEEN ON


Are You a Licensed Real Estate Agent or Broker?